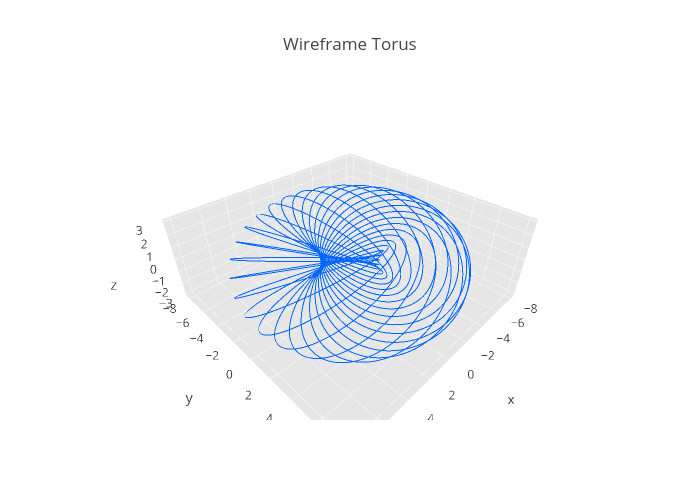
Plotly がなかなか使い心地が良いので、トーラスのワイヤーフレームモデルを Python で作ってみました。
ブラウザが対応していれば、図形は、マウスでグリグリして回転や拡大などできる。
3次元座標空間で円を回転させたりするので、数式の計算は数式処理モジュール sympy にさせます。
下のソースコードでは、Rx, Rz, v は関数として定義してますが、λ式にしないでも"数式"が代入されるだけなのでそれでもいいです。
つまり lambda α: とかはなくても良い。その場合は、Rx(α)とか書いているところは、Rxと書けばよい。
このあたり計算効率は全く考えてません。させたいことを、ただ記述するという方針で作ったコードです。
#!/usr/bin/env python
import plotly.plotly as py
import plotly.graph_objs as go
import numpy as np
from sympy import *
# Python3.xであれば、以下のギリシャ文字が使える
# αβγδεζηθικλμνξοπρςστυφχψωΑΒΓΔΕΖΗΘΙΚΛΜΝΞΟΠΡΣΤΥΦΧΨΩƏ ᐁ

# 記号の定義
R, r = symbols('R r')
θ, φ = symbols('θ φ')
α = asin(r/R)

# 軸の周りに回転させる変換に対応する行列を返す関数
Rx = lambda α: Matrix([[1, 0, 0], [0, cos(α), -sin(α)], [0, sin(α), cos(α)]]) # x軸の周りにα回転
Rz = lambda φ: Matrix([[cos(φ), -sin(φ), 0], [sin(φ), cos(φ), 0], [0, 0, 1]]) # z軸の周りにφ回転

# 中心(r,0,0),半径Rのxy平面上にある円周上の点の座標を返す関数
v = lambda θ: Matrix([R*cos(θ)+r, R*sin(θ), 0])

# 点v(θ)をx軸の周りに(α or -α)回転させ、さらにz軸の周りにφだけ回転させた点の座標を返す関数
f = lambda t,p: (Rz(φ)*Rx(α)*v(θ)).subs([(R,5),(r,3),(θ,t),(φ,p)])
#g = lambda t,p: (Rz(φ)*Rx(-α)*v(θ)).subs([(R,5),(r,3),(θ,t),(φ,p)])

Theta, Phi = np.linspace(0.0, 2*np.pi, 125), np.linspace(0.0, 2*np.pi, 25)

# Creating the plot
lines = []

line_marker = dict(color='#0066FF', width=2)
for p in Phi:
    x,y,z = [a.astype('Float64') for a in np.hstack([f(t,p) for t in Theta])]
    lines.append(go.Scatter3d(x=x, y=y, z=z, mode='lines', line=line_marker))

layout = go.Layout(
    title='Wireframe Torus',
    scene=dict(
        xaxis=dict(
            gridcolor='rgb(255, 255, 255)',
            zerolinecolor='rgb(255, 255, 255)',
            showbackground=True,
            backgroundcolor='rgb(230, 230,230)'
        ),
        yaxis=dict(
            gridcolor='rgb(255, 255, 255)',
            zerolinecolor='rgb(255, 255, 255)',
            showbackground=True,
            backgroundcolor='rgb(230, 230,230)'
        ),
        zaxis=dict(
            gridcolor='rgb(255, 255, 255)',
            zerolinecolor='rgb(255, 255, 255)',
            showbackground=True,
            backgroundcolor='rgb(230, 230,230)'
        )
    ),
    showlegend=False,
)

fig = go.Figure(data=lines, layout=layout)
py.iplot(fig, filename='torus_wireframe_plot')
If the total Player bets add a lot as} less than the Banker’s bet, any observers can cover the hole. If the bets amount to more than the Banker’s bet, the Banker can increase their bet, in any other case extra bets shall be taken off the table. Green Gaming is our award-winning technique for ensuring protected and sound taking part in}. With assist of|assistance from|the help of} our ingenious Green Gaming software, gamers can look at their betting behavior and 봄비벳 determine if it is sound or unsafe. The software comprises of an easy self-evaluation test that we mix with particular person information on actual game-play to compute a gambling behavior profile.
返信削除